Market Research Plan
7 Market Research Tactics, Tools & Templates
In this tutorial we look at the seven stages of market research planning and share MS Word and Excel templates for Market Research.
You can then use these forms, checklists, surveys, and questionnaires to complete the seven stages in the Market Research process:
- Stage 1 – Why You Need a Market Research Plan
- Stage 2 – Who are your Target Customers
- Stage 3 – How To Get The Information You Need
- Stage 4 – How Do You Collect Data
How to Train Your Staff
How to Make it Shareable
How to Avoid Corrupt Data
How to Design Questionnaires, Surveys and Polls - Stage 5 – Analyze Data
- Stage 6 – Generate Report Findings
Descriptive Data Analysis
Inferential Data Analysis - Stage 7 – Choose Best Strategies
Stage 1 – Ask Why?
The first side of my heptagon (ok, work with me here. I needed a useful analogy with 7 in it and Heptagon fitted the bill. It was that or the Seven Gods of Chaos. Heptagon won the toss…) is Why.
Why are you really doing this?
I know this seems obvious but… there are rational, easy to justify explanations and there are ‘other things’.
For instance, knowing why your product is underselling is a good thing. Your focus is clear. Armed with the results you can adjust the product’s price, features or other attributes.
If customer service tells you that callers are frustrated with the IT booking system, then the priority is to fix the booking system. The Market Research can wait until afterwards.
Developing a Market Research plan when you already know that there is a problem is getting priorities mixed up. The priority is to fix the system.
Of course, if you need to know why the system is difficult to use, then ask why.
The point is… before you start your Market Research Planning activities, be very clear what you want to get from it.
The more you can clarify your goals, the closer you’ll get to that target.
When others ask what you’re trying to achieve, instead of feeling that you have to justify this project in some way, you’ll have more confidence in your response.
In turn, this will be reflected in how they respond and respect your work. Because Market Research is often seen as a ‘grey area’ or dismissed as a ‘nice to have, but not essential right now’, make sure you are clear on why this needs to be done.
Real confidence is contagious.
Work with your team and map out the reasons why this project will benefit others.
This is how you’ll convert the skeptics. Show them what they have to benefit. Then reinforce the benefits with examples.
The first step is to clarify why are you doing this?
- What’s your objective? Define you over-arching goal in one sentence.
- What do you hope to get out of it? Identify the one piece of information the company does not currently possess.
- What’s your objective? When you have this information, how can you use it to drive other projects onwards?
- What questions do you want answered? Identify all the questions that need to be addressed and then prioritize the high priorities.
- How level of detail do you want the research to go into? Is this the first wave of a large marketing initiative or do you need to drill down into greater detail?
- How will you analyze the data? What factors will you use to examine the data and extract meaning from the feedback. Otherwise, it’s just a mass of data, right?
- What success criteria, if any, need to be established? For example, if you determine that 80% of customerswould pay $49 for a new product – and you interviewed a large sample – then this may be enough to launch the product. No more data gathering may be required.
- What will you do with the findings? Are you looking for a budget for further development, to release a product, or for marketing activities? Does this plan tie in with other marketing activities?
- Are others depending on you before they can make a decision, such as to release a new product?
Be clear with your goals.
Ensure that your team understands your objectives and how the research will benefit drive other activities forward.
For example, a mobile phone company wants to:
‘Offer customers free roaming calls in Europe help sell enough phones to justify this cost and allow us to upsell other products to new customers?”
This means that the main questions to be answered will be:
- Are customers interested in free roaming calls?
- Is Europe a more attractive market to them than the US? (Let’s say you’re targeting business travelers.)
- Can you upsell products to new customers?
- How would you price the new products?
- Is there opportunities for partner tie ins?
Notice that this is a very narrow focus. Essentially, we want to know if business travelers (a small but lucrative segment of our customer base) would buy new products from us if we offered them free roaming across Europe.
Once you are clear on your objective – and how it assists other business units – you can develop your Market Research plan with more confidence.
That’s the first side of our Market Research heptagon. Let’s more it around and see what’s next.
Market Research Excel Template
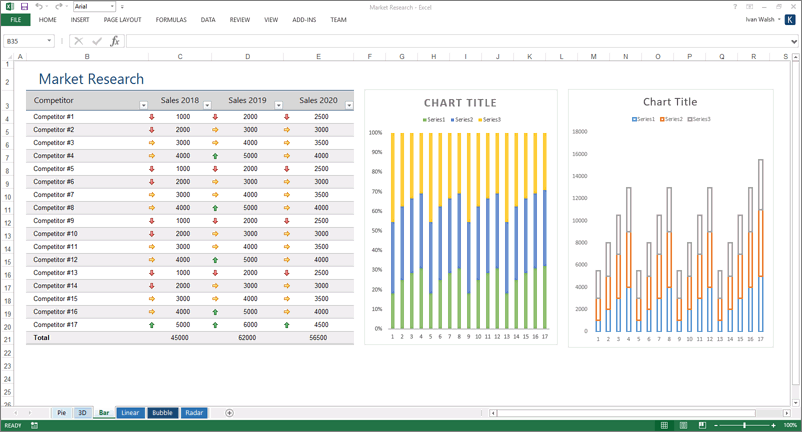
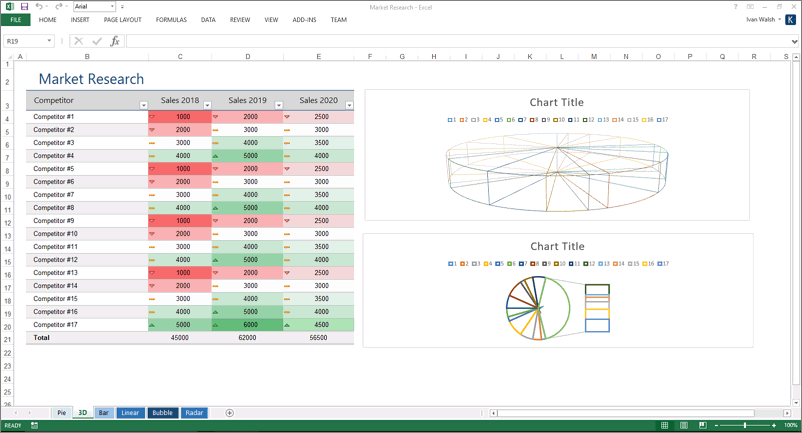
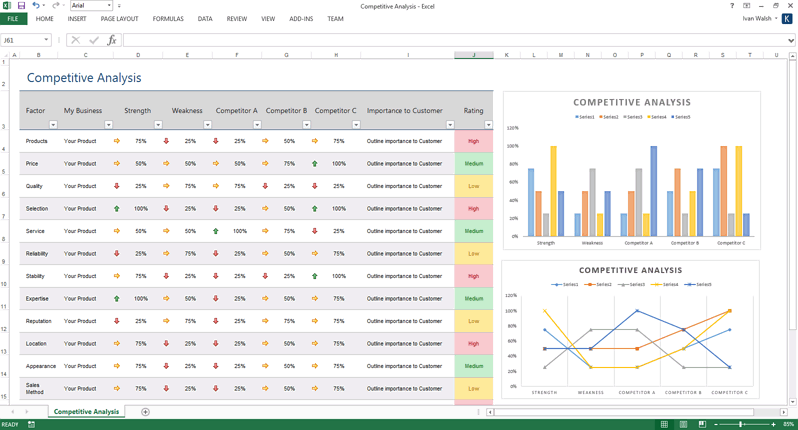
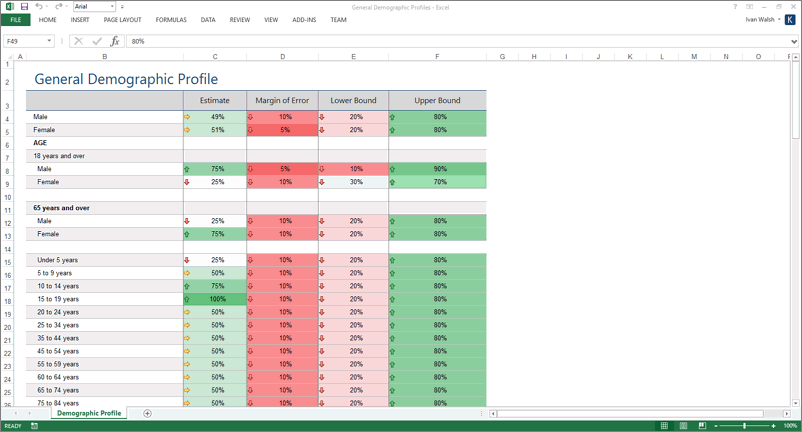
Here are screenshots of the Market Research Excel templates.
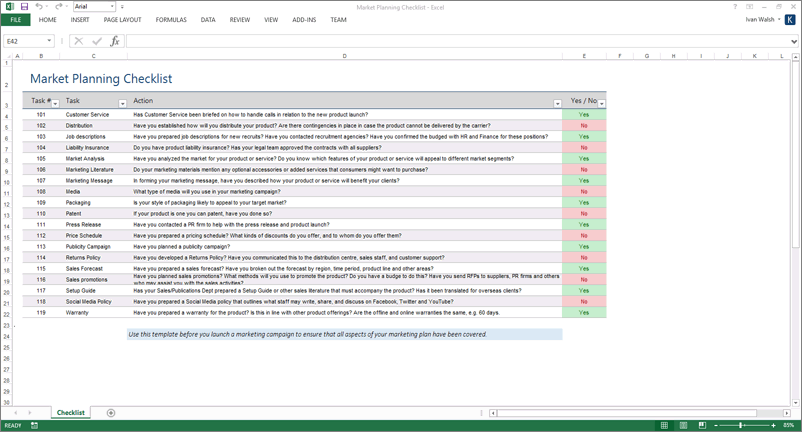
Market Planning Checklist with conditional formatting
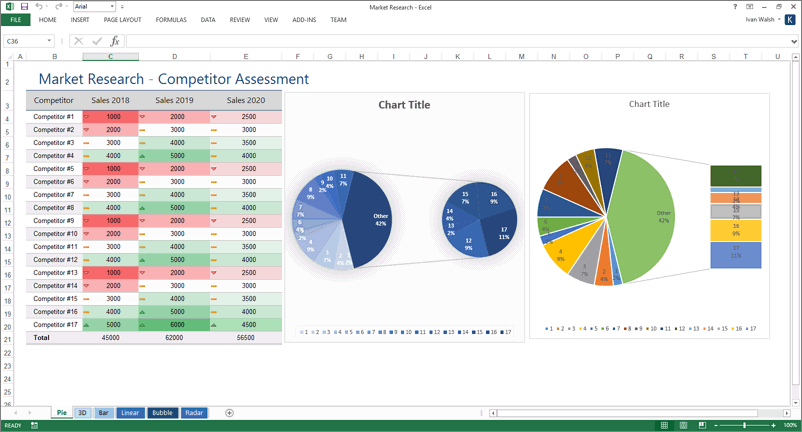
Competitor Assessment spreadsheets with different charts
Competitive Analysis spreadsheet
Feedback Form and Customer Ratings
Market Research Templates: Format & Content
Stage 2 – Who are your Customers?
Yesterday, we introduced the idea of a heptagon into this series of Market Research tutorials. It seemed a bit crazy the time but it does make sense.
Instead of seeing your Market Research project as one single activity with definite Start and End points, step back and look at it more holistically.
Rather than seeing it as one long road you need to travel, look at the side roads that feed into it.
This approach helps me when I get maxed out. I hit a wall in one area. Rather than forcing myself to complete this task (now a soul-destroying chore, tbh), I look at the plan for another side and find new energy there.
Did you ever notice that moving your attention from one to another suddenly releases new energy? It’s a bit like that.
So, if you reach your limit with one area in your plan, leave it aside for a day. Work on another area. Then come back to the first one when you’re recharged.
Which brings us back to…
Some Customers are More Important Than Others
If you’ve read Animal Farm, you’ll know what happened to Snowball.
‘All animals are equal, but some are more equal than others.’
And it’s the same with customers.
Think of it like this. One guy buys from you every time you put a new ebook online. He snaps them up and posts great recommendations on the web. This guy is gold.
Another buys once. You never hear from the again.
It’s a no-brainer, right?
This means that part of the market research plan is defining your real customers.
Or, put it another way. We need to scratch the surface and learn more about our target customers than we think we do, especially those of most value to us.
Don’t Make This Mistake
One common mistake in marketing is to assume that your customers don’t change.
Of course they do.
Everyone changes.
So, your research is to challenge what you think you know of your existing customers.
And then look at ‘prospective’ customers.
You may have no ‘hard data’ on them – so you need to get moving, pronto!
So, using the goals we defined in the Why section, we can examine our target customers and see how we can ‘reach’ them.
Reach is one of those buzzwords used in Market Research to cover how you will contact customers, the media channels you will use, and the different ways to gather data.
For example:
A sample of 100 may give one set of results, whereas a larger number may give you richer feedback. Cost is usually a factor here as the price per head adds up, especially if you’re doing the research for your own company.
For example, sharing the report findings and/or vouchers to your products may work. Again, it depends on your target audience and what’s most valuable to them.
Another example… my email software lets me segment my list and target emails at different user groups. This means I can match my market research to the user group most likely to respond and avoid ‘spamming’ others.
You can also rent email lists but you need to do this with caution. Many of these lists have been harvested without the user’s consent. As well as offending the users, the ISP may block your email account if there are a high number of complaints or bounces.
What incentives will you offer?
I use a variety of approaches to encourage folks to help with the market research. Some of these are typical offerings such as free offers, vouchers, instant downloads, reports, and other teasers.
This is the classic, ‘you scratch my back and I’ll scratch your back’.
And it works.
There are other ways.
For example, we identified a group of high earners for a banking project. We told them – and this was true – that there were in the top 3% of all earners on our books.
‘Would you like to test run the new Wealth Management System before it goes live?’
There was no shorter of takers. Many high-earners wanted to use the system because of their privileged status. They were capitalizing on their social position.
You can do the same thing with any line of professionals by appealing to their status, vanity or greed. There’s different ways of persuading folks to engage. Sometimes it’s more about how you ‘position’ the market research to them.
Consider dropping the phrase ‘market research’ and use something that triggers different emotional buttons.
Dig deeper: Marketing Plan
Market Research MS Word Templates
Here are some screenshots of the MS Word templates for Market Research.
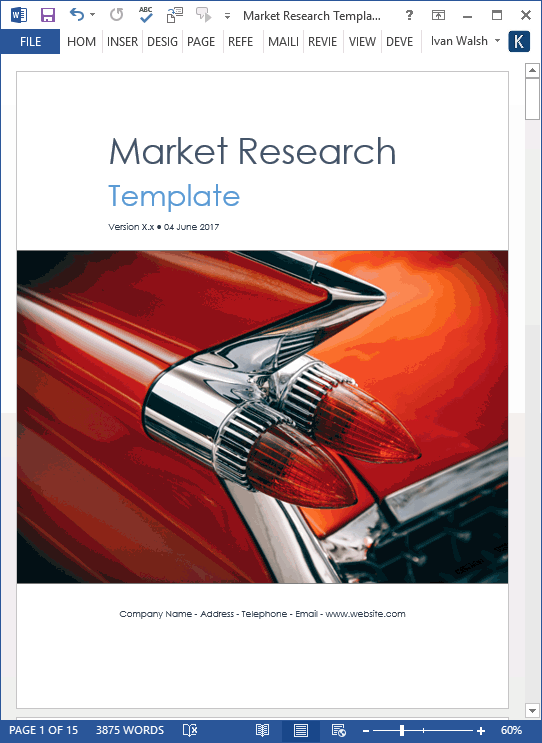
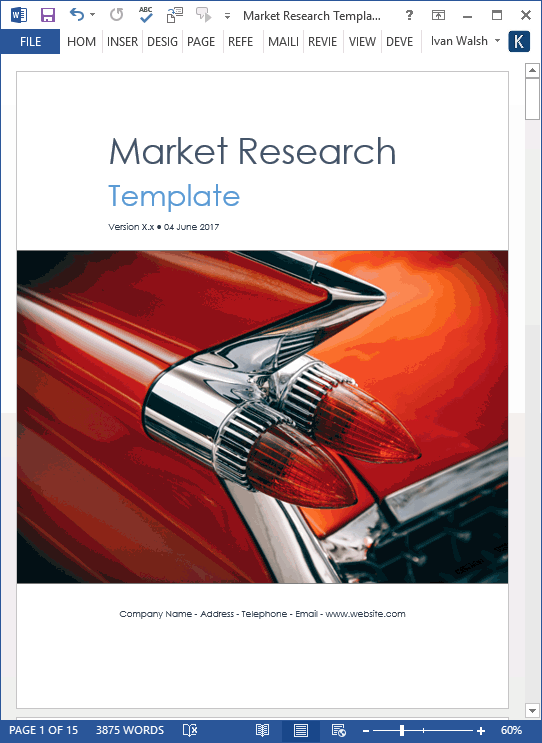
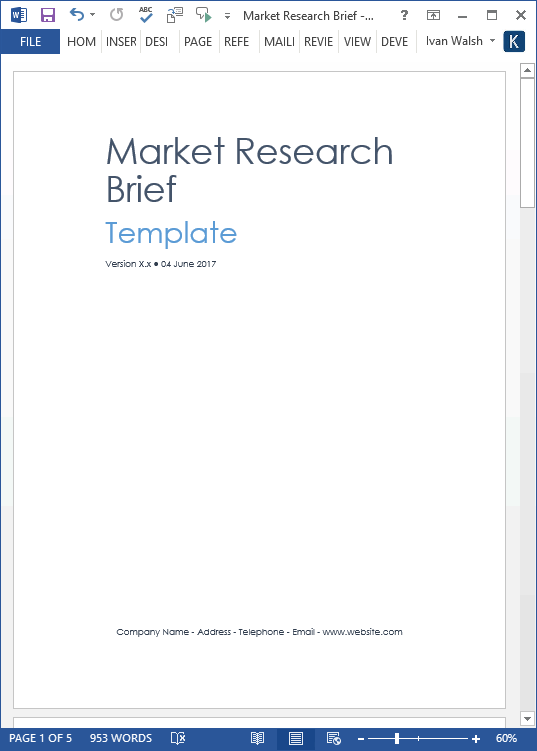
Standard cover page
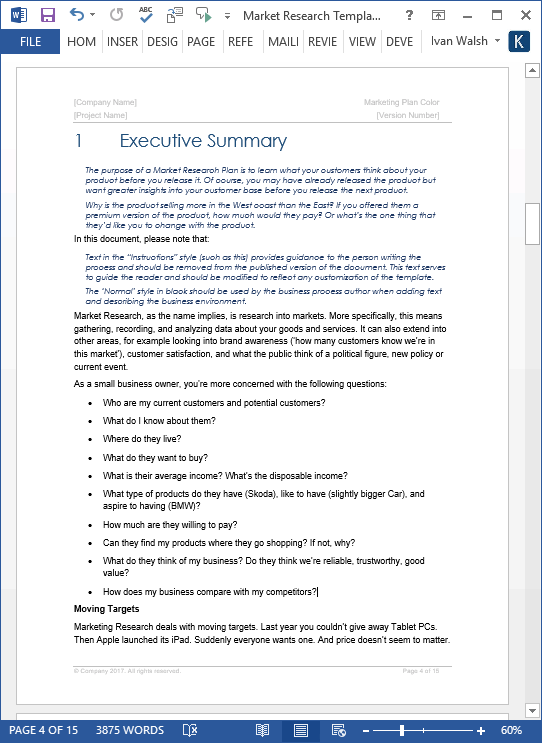
Executive Summary to Market Research Plan
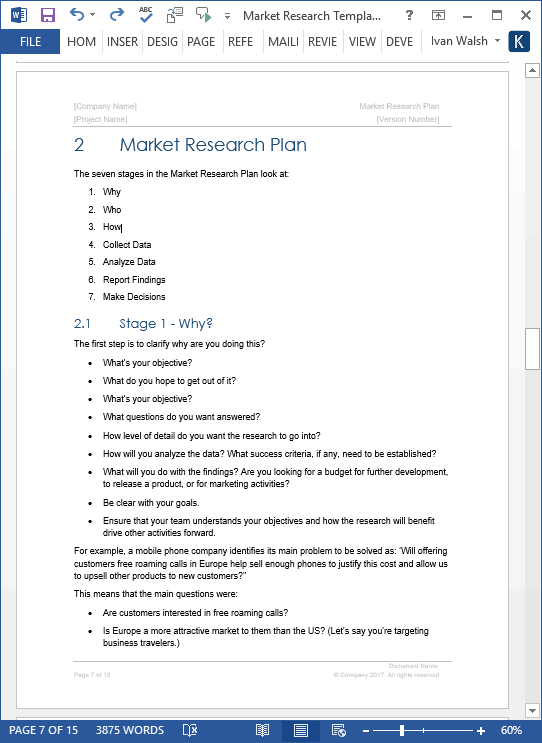
Instructions on how to write the Market Research Plan
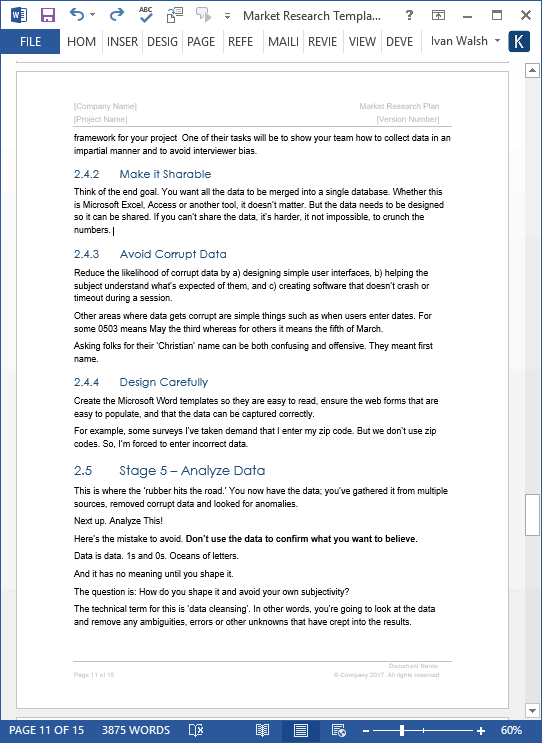
Further details of the market research plan
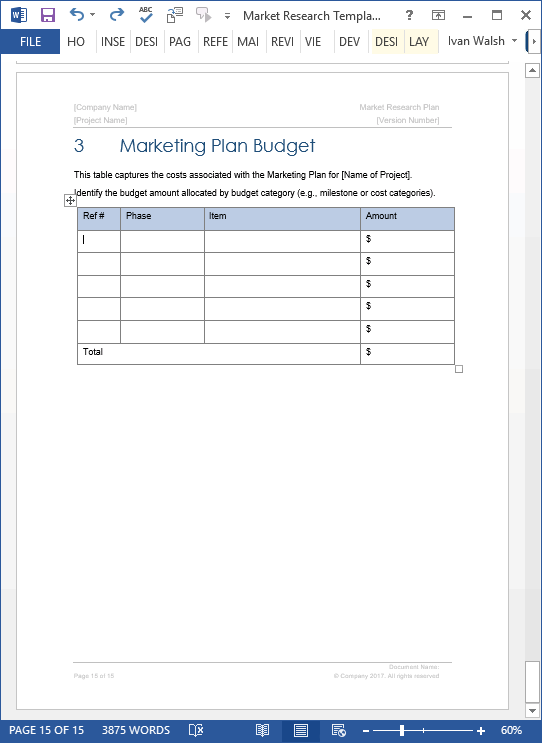
Budget Plan
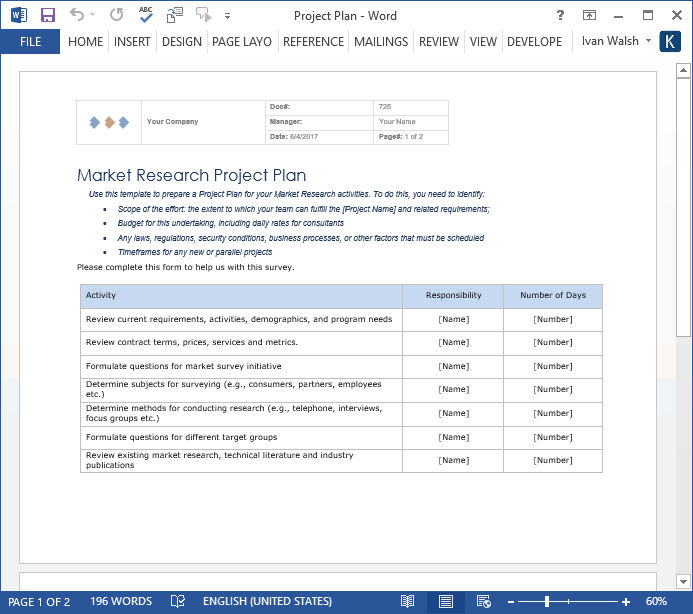
Market Research Project Plan
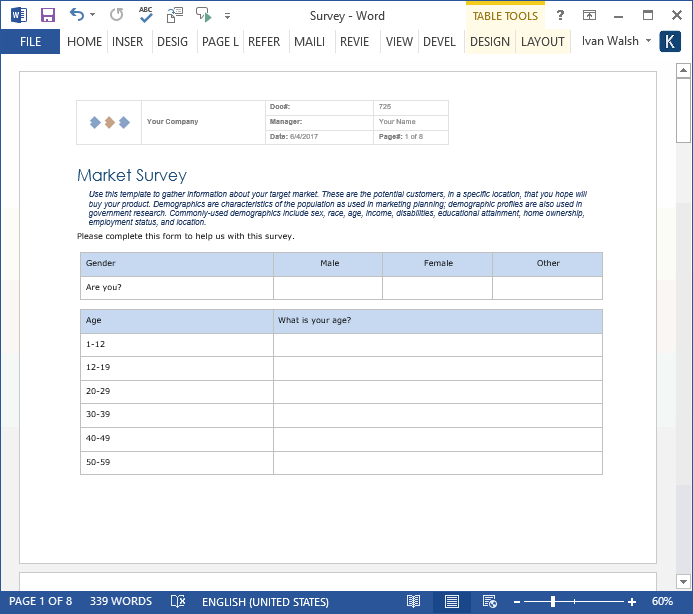
Market Survey Form
Stage 3 – How Are Find The Information You Need
Now that you know Why you need this information, Who you will target, the next step is to see How will get it.
Let’s step back.
There are different ways you can get this market research data: email, phone, web, even in the shopping mall.
But you have a budget, right?
This means that you need to consider which approaches worked best the last time. Look at the returns. Based on these results, use the channels that give you the best return. And, if there is money left over, try the next channel.
Sometimes it’s not that simple.
Maybe you can contact 10 on the phone for the same cost as 100 on the web. But the quality of data from the phone calls is substantially better than what you get on the web.
Trained interviewers can probe the person over the phone and extract information that will not be captured in Multiple Choice questionnaire. Likewise, the phone caller may volunteer information that you hadn’t thought of.
Dig deeper: Marketing Plan
For this reason, evaluate the best approach to gathering quality information.
You have different options, such as:
- Focus groups
- Observational research
- Polls
- Questionnaires
- Surveys
- Interview by Telephone
- Interviews in person
Next, you need to create a Schedule (like a Project Plan) to put all these tasks against target dates. The key is successful market research is getting the right information but also staying within budget. Keep your line manager up-to-date with your progress and show him the time line for your activities.
Stage 4 – How To Collect Data
The next stage involves collecting the data. While this sounds easy at first – you just collect it, right? – it can be problematic when the data is corrupted, conflicts with earlier reports, is received in file formats that are not compatible with your software, or there are gaps in the data making it hard for the analysts to draw conclusions.
Here are a few suggestions to collect data:
Train Your Staff
Before you start collecting data, train, educate, and supervise your own team. If this is the first time engaging in Market Research Planning at your company, consider hiring a Consultant to create a framework for your project One of their tasks will be to show your team how to collect data in an impartial manner and to avoid interviewer bias.
Make it Sharable
Think of the end goal. You want all the data to be merged into a single database. Whether this is Microsoft Excel, Access or another tool, it doesn’t matter. But the data needs to be designed so it can be shared. If you can’t share the data, it’s harder, it not impossible, to crunch the numbers.
Dig deeper: Marketing Plan Template Guide
Fix Corrupt Data
Reduce the likelihood of corrupt data by a) designing simple user interfaces, b) helping the subject understand what’s expected of them, and c) creating software that doesn’t crash or timeout during a session.
Other areas where data gets corrupt are simple things such as when users enter dates. For some 0503 means May the third whereas for others it means the fifth of March.
Asking folks for their ‘Christian’ name can be both confusing and offensive. They meant first name.
Design Carefully
Create the Microsoft Word templates so they are easy to read, ensure the web forms that are easy to populate, and that the data can be captured correctly.
For example, some surveys I’ve taken demand that I enter my zip code. But we don’t use zip codes where I live. So, I’m forced to enter incorrect data. Imagine the confusion that causes?
Stage 5 – Analyze Data
This is where the ‘rubber hits the road.’ You now have the data; you’ve gathered it from multiple sources, removed corrupt data and looked for anomalies.
Here’s the mistake to avoid. Don’t use the data to confirm what you want to believe.
Data is data. 1s and 0s. Oceans of letters.
And it has no meaning until you shape it.
The question is: How do you shape it and avoid your own subjectivity?
The technical term for this is ‘data cleansing’. In other words, you’re going to look at the data and remove any ambiguities, errors or other unknowns that have crept into the results.
Dig deeper: Marketing Plan Template Guides
A good example of this was the US Presidential election between George Bush and Al Gore.
Small details like this can have immense impact on the final results. You need to allow for unknowns creeping into your research results and take steps so they don’t influence the final results.
How to Clean Data?
Cleaning data involves editing, coding, and tabulating results. To do this, start with a simply designed questionnaire (or a similar tool) and:
- Subjective – Rely on subjective information to support general findings only.
- Objective – Gather objective information to support more specific findings. Objective data gives you a neutral view of how others see your product. If you ask your team – or even your current customers – what they think of a new product, more than likely then will tell you what you want to hear. Those outside the organization will be more impartial.
- Look for anomalies and inconsistencies – if there is a sudden change in the results, look at what triggered the shift. Likewise, if results from one team conflict with another team, sit down with them and see how they’re gathering the data. They may have made some errors in crunching the numbers or interpreted the results incorrectly.
- Compare – Look at the results of different data collection methods. For example, if you run polls online and offline about the same subject, for example, the customer’s favorite brand on designer shoes, look at the results and see if they agree.If you’re targeting the same age group and demographics, they should agree, right? If not, dig deeper and see why 20 something’s online give different than 20 something’s offline. Hint: people tend to be more ‘creative with the truth’ online than when interviewed face to face.
- Use other sources of information – For example, you can use U.S. Census Bureau statistics on median income levels for a specific city/state and other official research findings to give your findings more balance.
Stage 6 – Generate Report Findings
At this point, you should have all the data gathered in Microsoft Excel spreadsheets and other formats you can share.
Remember your initial goals?
Break out the findings so it answers the questions you had at project kickoff. You can show this in, for example, Demographic Comparison or Competitor Analysis Worksheet.
Use what’s appropriate and make it easy for the reader, especially those further up the line, to extract the key findings.
Data Analysis usually falls into two categories:
Descriptive Data Analysis
This is where you describe the collected data usually by summarizing the findings. For example, you can highlight how many liked or disliked your new product. Use charts and tables to illustrate the data. Provide legends that explain different categories, volumes or amounts.
Inferential Data Analysis
While Descriptive Data Analysis focused on describing the findings, these are of limited use until placed in context. That means you try to use information taken from a small group to ‘infer’ what a larger group would do, compare groups and see where/how they behaved differently, and forecast what may happen based on the information you have gathered.
For example, let’s say you want to know how customers from London, Paris, and Dallas rate different products. You prepare a survey with ten questions asking customers from all three cities to rate customer satisfaction on a scale of 1 to 5.
Once the survey is completed, you can compare each group using statistical software and test if differences exist.
Microsoft Excel has some very powerful functions, such as pivot tables that are very effective at analyzing data.
This type of marketing analysis offers richer information than simply showing how many customers from each city responded to each question.
Stage 7 – Choose Best Strategies
Now you have to make a decision.
In some companies your findings will be handed over to other teams, for example Product Development or the Marketing Department, for them to decide. It depends on how you’re it structured.
One thing to consider is that the market research should shed light on new areas. If the findings confirm what you already know, look at how you’re gathering the data, where it comes from, and who compiles the information.
In a dynamic world, findings should rarely stay the same.
‘Were the findings good?’
You may be asked this during your presentation. Findings are neither good nor bad. They’re a snapshot of how customers see your product, for example.
How people interpret data is up to them. Your job isn’t – or shouldn’t be – to skew the data so management hears what they want to hear. If customers are dissatisfied, it’s their job to remedy it, not yours.
One final tip.
Close on a positive note.
Even if the information is down-beat, look for some positives in the information you gleaned. Don’t fudge the issues but remind the audience that we now know more than yesterday.
Market Research Templates – 5 x MS Word + 14 x Excel
This Market Research Template pack includes 19 templates (5 Word+ 14 Excel). You can use these templates, forms, checklists, and questionnaires to gather, record, and analyze data so you have the information you need to drive your Business Plan and Marketing strategies forward. This template pack includes:
- 4 x Market Research Templates (16 pages) Use these template to capture Why You Need Market Research, Who You Want to Target, How to Plan, Collect Data, Analyze Data, Report Findings, and Make Decisions.
- Market Research Brief Template (6 pages) Use this document to brief Consultants on your Market Research requirements.
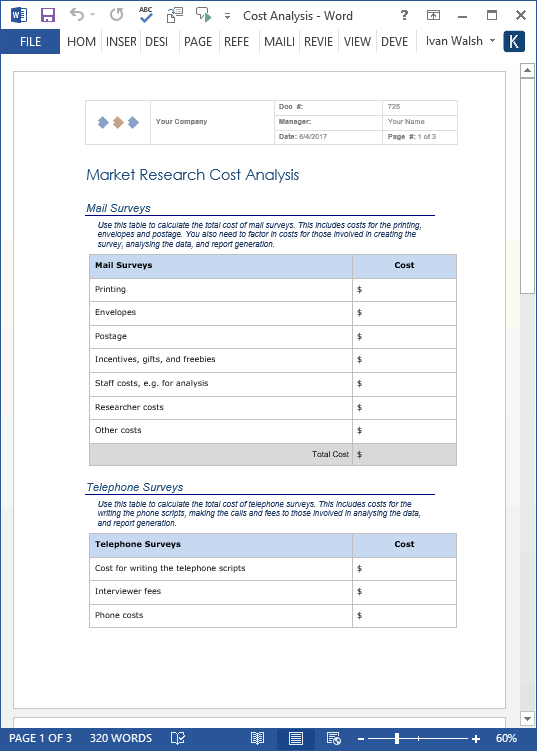
- 14 Free Excel Templates: including Brand Loyalty Survey, Competitor Analysis, Demographic Comparison, Demographic Profile, Industry Analysis Checklist, Market Planning Checklist, Cost Analysis, Market Research Spreadsheet, Market Survey.
Learn more about these templates here

